Everyone’s talking about Google Analytics, and they make it sound like it can do anything. Maybe not, but let’s talk about what it can do for you.
More details and screenshots can be found at the end of this blog. Keep reading!
Yesterday is Over, Tomorrow is Too Late
First: You need to set up Google Analytics right now. Not tomorrow or the next day. Now.
Why? Google won’t bother keeping data on your site unless you’ve signed up for Google Analytics. It won’t track the information you need until you say yes, please. So, even if you’re not planning to use this data for a while – sign up for it now. Get it connected to your website right away so you can start capturing information.
If you’re a customer at Fourandhalf, we are eager to help you get this off the ground. Let our team get the software up and running even if you’re not ready for the data party yet.
Maybe you’re between websites or planning a new site. You still want to set up Google Analytics today. This will help you compare the performance of your current site to that of your new site.
Trends and Tracking – Knowledge is Power
What does Google Analytics do?
Google Analytics is a web analytics service that shows you trends in your web traffic over time. This freemium service will answer all the questions you should be asking to grow your business, such as:
- How many visitors does your website get in a day? In a year?
- Did you get more visitors this year than last year?
- Do you get more visitors at the beginning of the month, when tenants want to pay rent?
It can give you all that information, and also answer the Big One: How many people are bouncing?
Some visitors bounce like a bad check.
They’ll find you on a Google search, click to a page on your site, and then swiftly exit your site without going to any other pages. This will count against you because Google wants to see that your site answers the questions that users are typing into the search engine. A high bounce rate for one of your pages generally indicates that the page does not have the answers for which visitors were searching. Google wants to see that when it sends visitors your way, they are satisfied by your content and they stay for a while, clicking deeper and going from page to page.
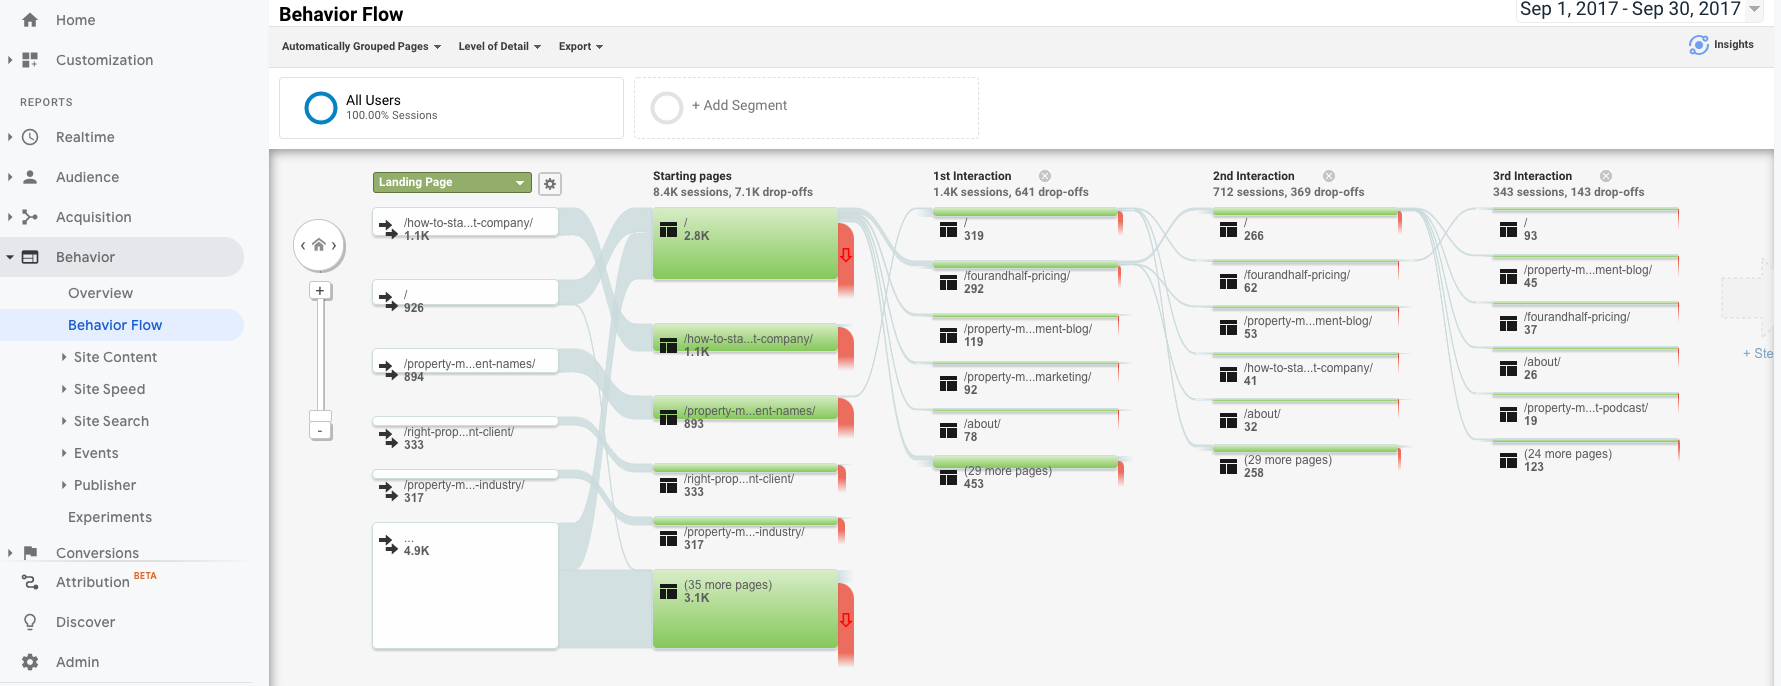
Analytics can show you the Behavior Flow of your visitors. Maybe they will land on your home page, then go to the vacancy page, then visit other places. This tool will allow you to trace the path of your visitors from the initial page they entered into, through the pages they’re visiting, through to where they drop off.
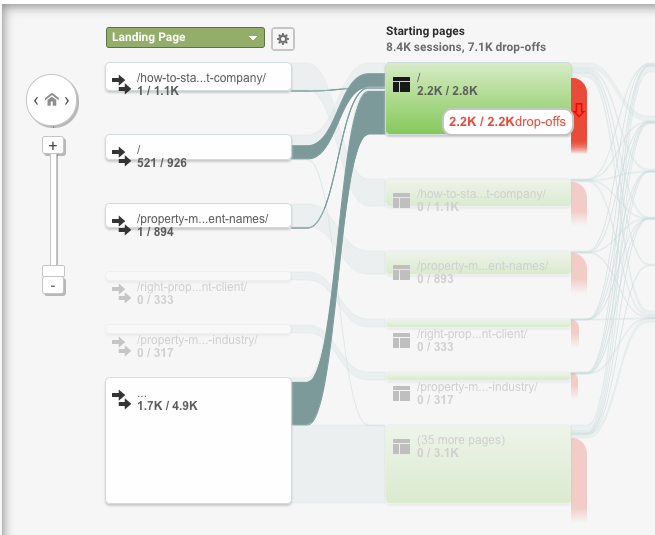
Google Analytics will show you where people are Dropping Off. Knowing which pages serve the purpose of guiding visitors toward the point of conversion while other pages send them away will provide you with the insight you need to make changes to those unsuccessful pages. This can make the difference between a visitor who drops off and a visitor who becomes a customer.
You’ll know what your most Popular Pages are. The home page will probably be number one, then possibly your vacancy page. But, if you’ve done a lot of blogs, and you should be doing a lot of blogs, you will know which blogs are most popular. So, you can do additional blogs expanding on those topics, generating even more successful content.
And Then There’s Google’s Search Console
Google Analytics and Search Console are two separate entities. Just because you have one, doesn’t mean you have both.
It is worthwhile to connect Search Console to Google Analytics as well. With it, you can find out which keywords web users are finding you with, and how often. Maybe it’s a search for Austin property management that’s leading people to your site – but maybe it isn’t. We’ve seen a client get found for a search on the keyword phrase, the tenant from hell.
Search Console will tell you how often you were found and clicked on versus how often you were seen but passed up for another site. This is critical information if you are trying to improve a property management website. There are multiple groups of people trying to visit your site – prospective and current tenants and owners. Are you appealing to the right audience?
This is an especially powerful tool in your arsenal when you’re trading in an old site for a new site. You want to know which keywords you’re being found for now. Were there keywords that brought you leads on your old site but that haven’t been used enough on your new site?
This can be a huge contributor to the loss of leads. And nobody wants that.
Set your goals and let Analytics track them for you. Is your listing making you money? Are people filling out your contact forms? Are you getting more forms now than you did on your old site? Track these goals and use the information to make changes.
So our question is starting to sound more like…
What Can’t Google Analytics and Search Console Do for You?
As you can see – you need Analytics. You need a Search Console. You need this information.
These are just some of the things that the Google machine can do for you.
We want to set this up for your company because it helps us help you. Contact us at Fourandhalf Internet Marketing for Property Managers, and we’ll get started.
* * *
Detailed Guide to Google Analytics
As promised, below are the detailed Google Analytics instructions and screenshots. Happy Analyzing!
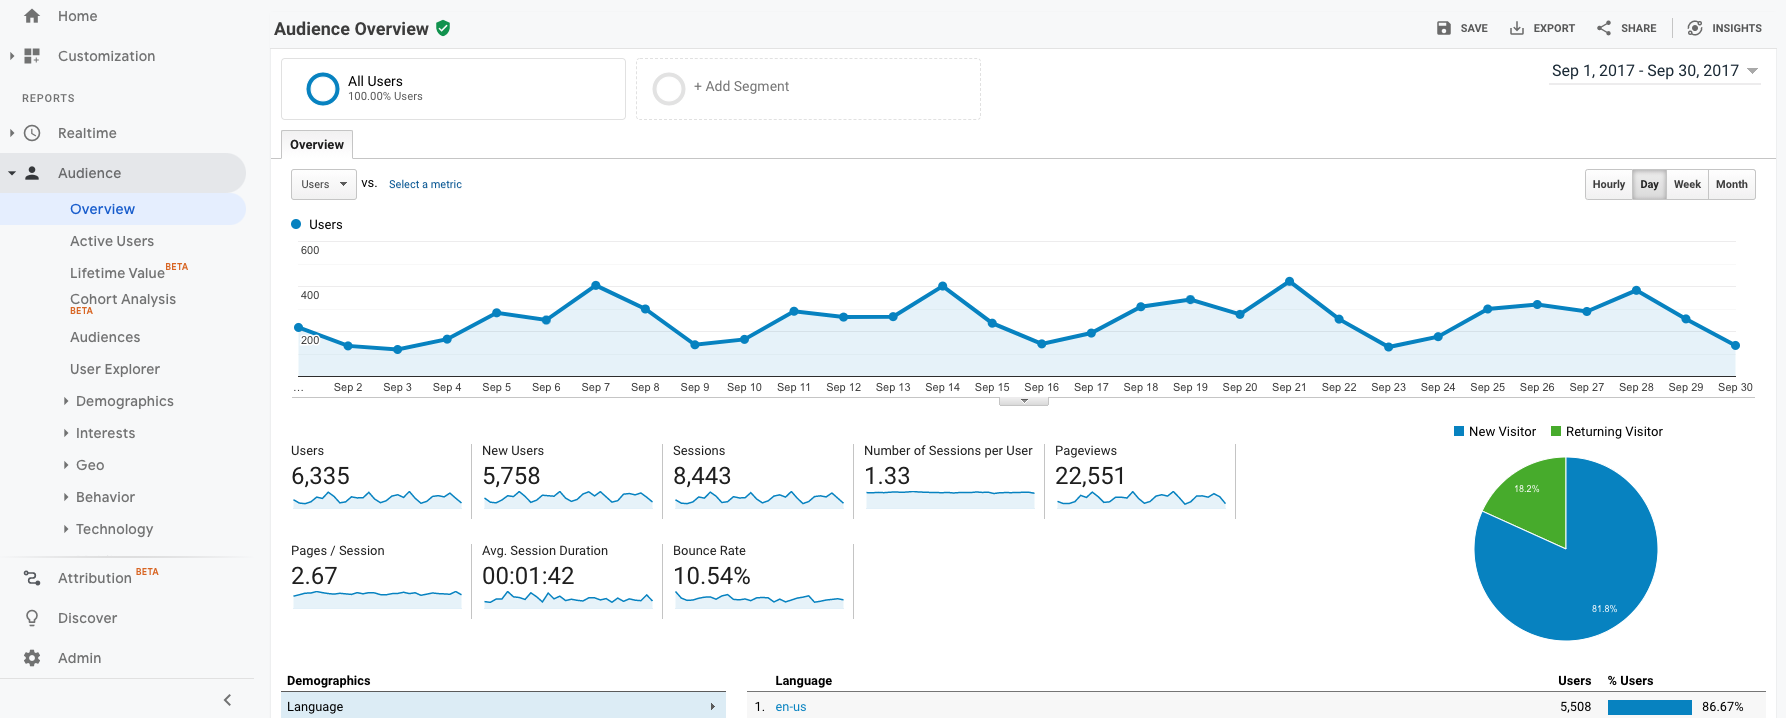
How many visitors does your website get in a day? In a year?
This information is in the audience overview. A snapshot of your audience overview is displayed on the home page, or you can navigate to the audience overview using the left sidebar. Customize the date or date range you’d like to view using the menu on the upper right of this page. The number of sessions indicates the number of times your website was visited, while the number of users indicates the number of devices that were used to visit your website. A higher number of sessions than users means that some of your visitors have used your site more than once, which is a good thing!
Did you get more visitors this year than last year?
In the audience overview, change the date range to custom and create a custom date range spanning from the beginning to the end of the year. You can compare the current year to date, starting January 1st, or the full previous year as shown in the example below. Check the box beneath your date range to “compare to” the previous year, the previous period or another custom range.
Do you get more visitors at the beginning of the month, when tenants want to pay rent?
On the same page, decide which month you would like you’d like to evaluate. In this example the date range is set to September 2017. By selecting custom date ranges you can compare the beginning of the month to the end of the month. This report indicates that this website received an 8.70% uptick in users during the second half of the month.
How many people are bouncing?
The audience overview will show you the bounce rate for your entire website for any date range you enter. Change the metric you’d like to measure by selecting it from the drop down menu above the graph.
Even better, you can compare bounce rates of specific pages on your site by navigating to the Behavior option on the left menu bar, opening the dropdown for Site Content and selecting All Pages. You’ll see the average bounce rate for all your pages at the top of the chart so you can easily see which of your pages are performing below average.
Where is the behavior flow?
Navigate to the left menu bar to select “Behavior Flow.” Change the date range at the upper righthand side of the screen to look for changes in visitor behavior over time.
Where are people dropping off?
Hover over the red drop-off graphic in the Behavior Flow to view the drop-off statistics for a page.
What are your popular pages?
Navigate to an overview of your most popular pages by returning to Home and scrolling down to the snapshot, or view a more comprehensive breakdown in All Pages under the Behavior tab.
